K/1st: Week of 8/26
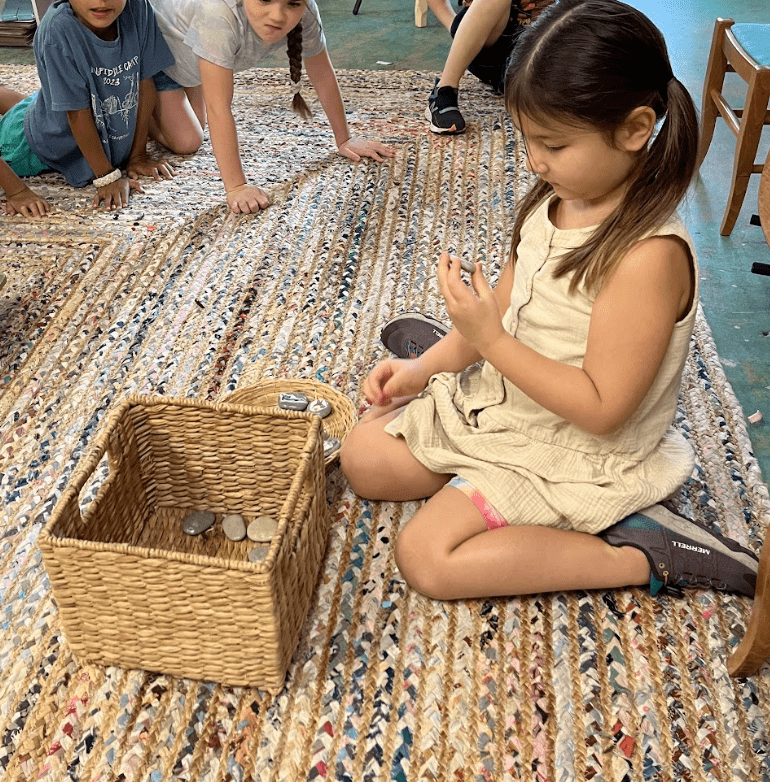
This week in Alpha… We’d like to send a big THANKS and deep bow of gratitude to Michelle, Sarah(and Roonie), Megan, and Katie(and Noodle), who were able to help us last-minute on our Hyde Park walk- and to Louise for hanging our beautiful self-portraits in the hallway! Doing our jobs is important! Calling out Choosing Stones for morning snack Our Big Backyard takes us to…Hyde Park! Last year we learned all about what was inside our bodies, and what each system needed in terms of care and feeding in order to stay healthy. Where people live is important to our […]
K/1st: Week of 8/26 Read More »